Space Weather
Real-time solar activity, geomagnetic conditions, and aurora forecasts for Central New York
Data from NOAA Space Weather Prediction Center and your local weather station
Current Space Weather Conditions
Space Weather Alerts
NOAA Space Weather Scales
Aurora Forecast for Central New York
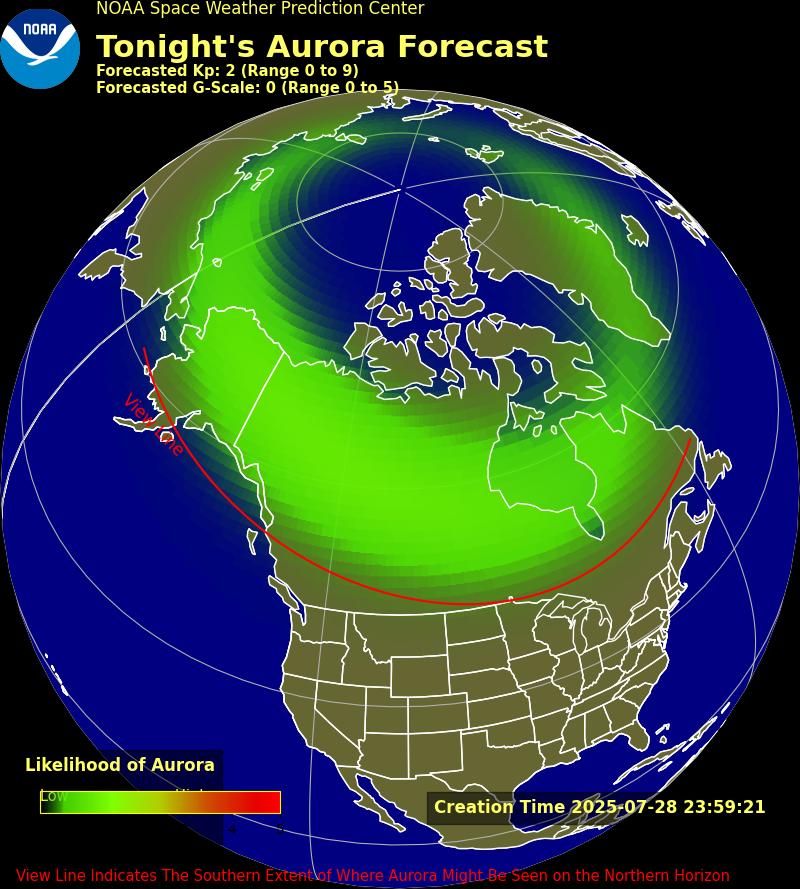
Aurora Viewline Forecasts
Tonight's Forecast
Tomorrow Night's Forecast
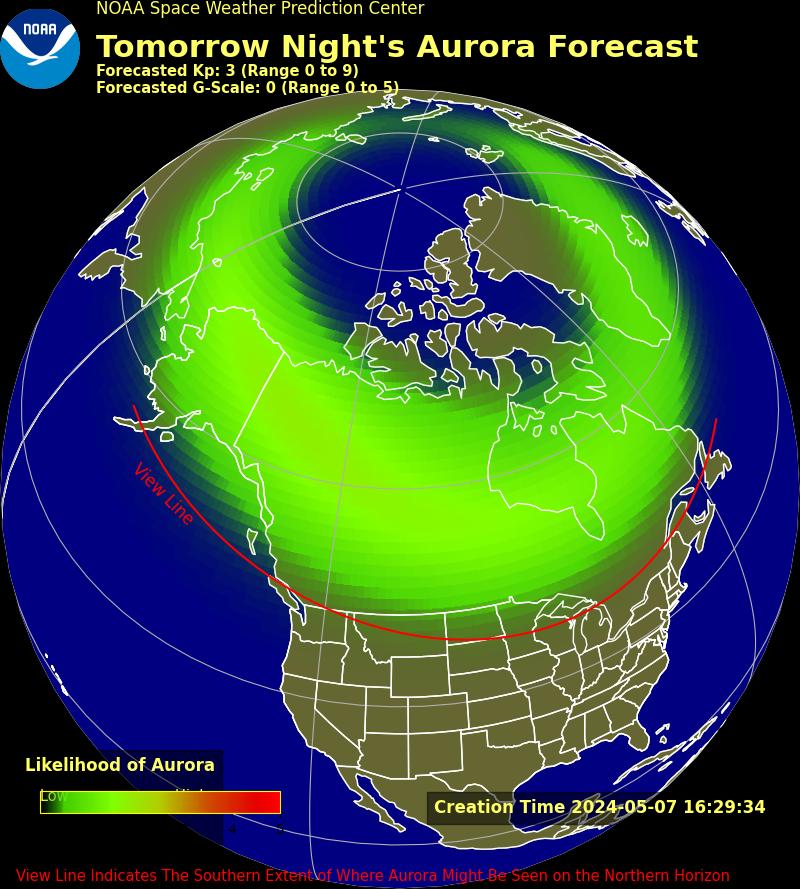
Aurora visibility is best during dark hours away from city lights. Higher Kp values indicate better aurora viewing conditions.
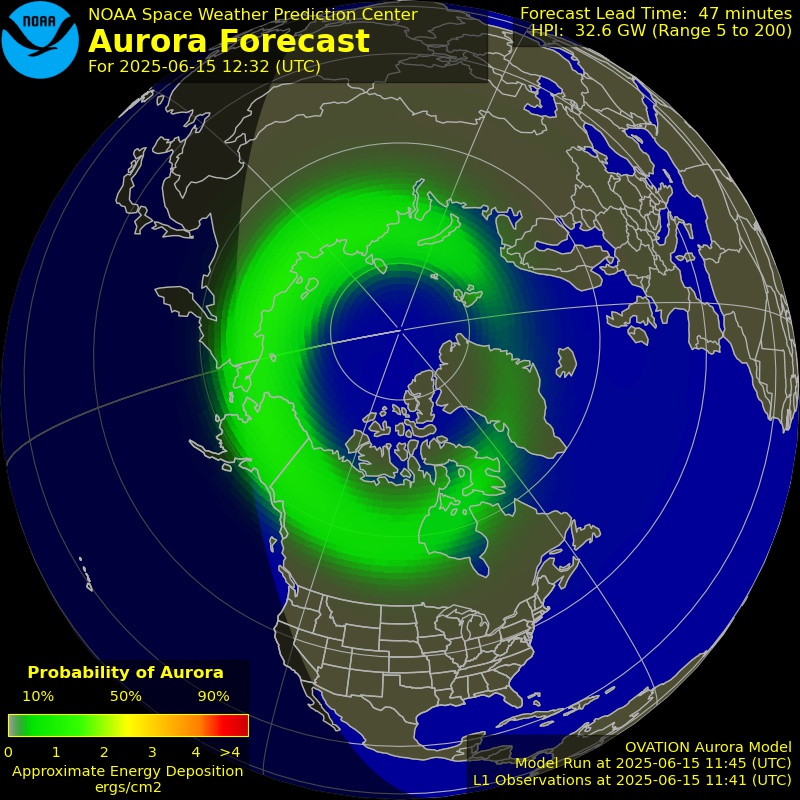
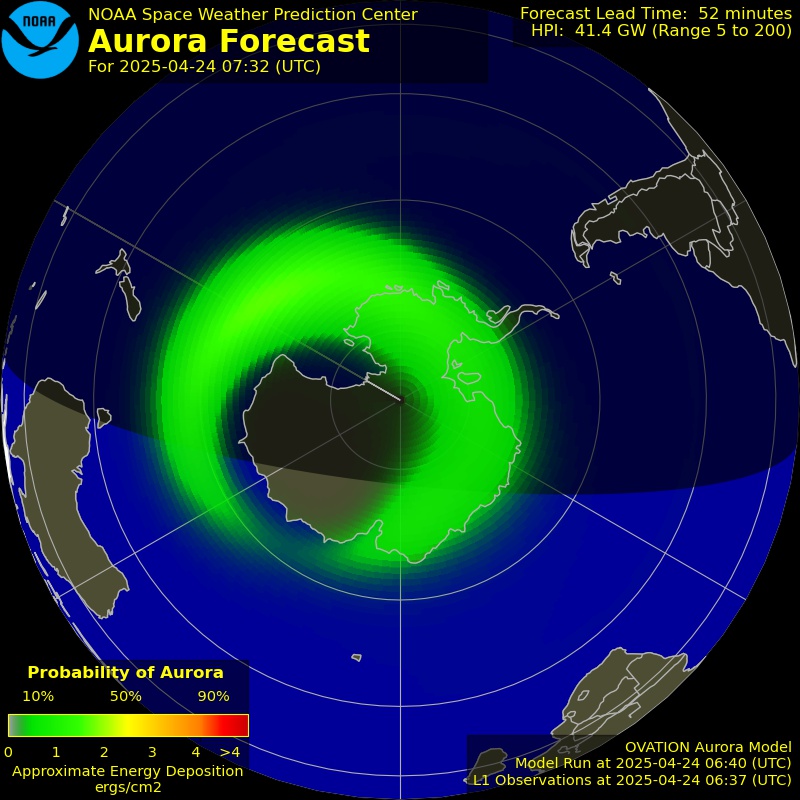
Real-time Aurora Ovation Plots
Northern Hemisphere
Southern Hemisphere
How Kp Affects Aurora Visibility
Kp = 3 (Quiet)
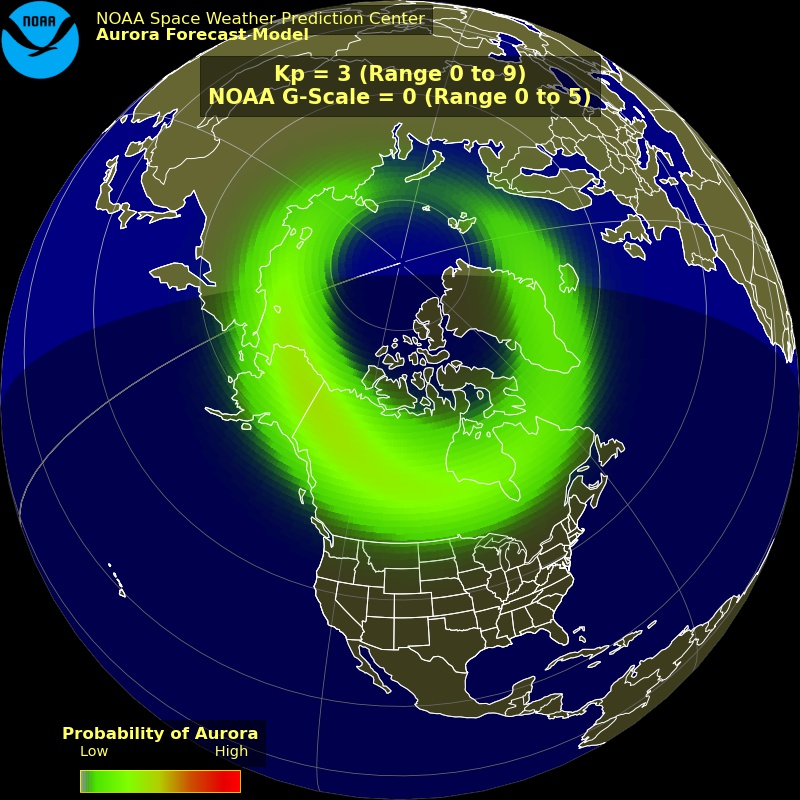
Quiet Aurora
Kp = 5 (Moderate)
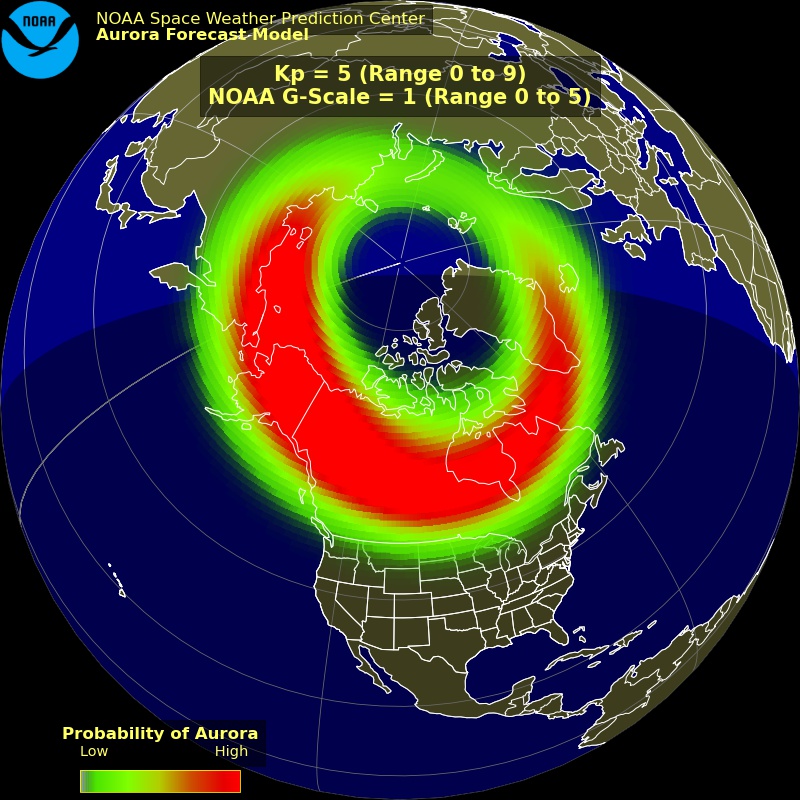
Moderate Aurora
Kp = 7 (Active)
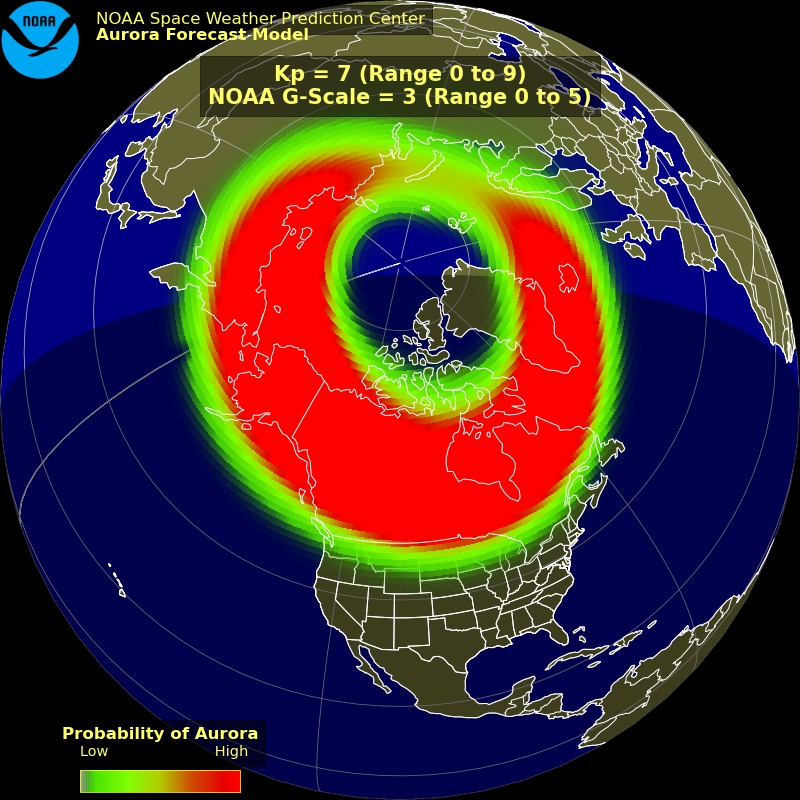
Active Aurora
Kp = 9 (Very Active)
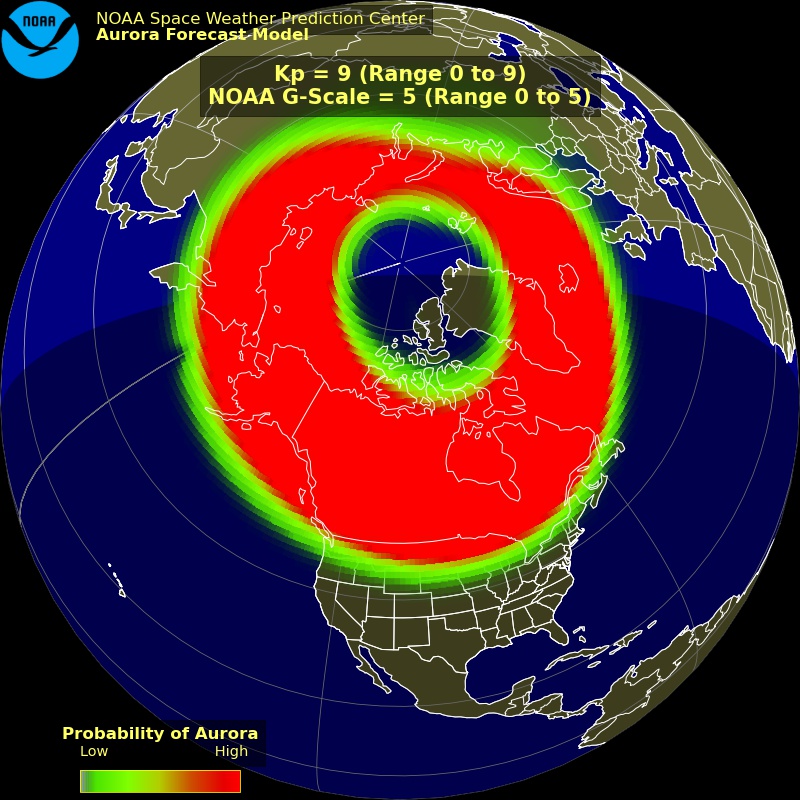
Very Active Aurora
Space Weather Summary & Education
Understanding Aurora & Space Weather
What is the Aurora? The aurora (northern and southern lights) are colorful displays of light that occur when charged particles from the sun interact with Earth's magnetic field and atmosphere. The aurora's colorful green, red, and purple light shifts gently and often changes shape like softly blowing curtains.
What Drives the Aurora? The Planetary K-index (Kp) measures geomagnetic activity on a scale of 0-9. Higher Kp values indicate stronger geomagnetic storms and better aurora viewing conditions:
- Kp 0-2: Quiet conditions, aurora unlikely
- Kp 3-4: Minor activity, aurora possible at high latitudes
- Kp 5: Minor storm, aurora visible in northern US
- Kp 6-7: Moderate storm, good aurora viewing
- Kp 8-9: Strong storm, aurora visible at lower latitudes
Best Viewing Tips:
- View during dark hours away from city lights
- Look toward the northern horizon
- Monitor space weather forecasts for activity
- Higher Kp values = better viewing conditions
NOAA Advisory Outlook & Forecasts
Official NOAA Space Weather Advisory
Summary Period
May 4-10
Outlook Period
May 11-17
Geomagnetic Activity
- G2 (Moderate) geomagnetic storms were observed on 04 May due to coronal hole influence.
- G1 (Minor) geomagnetic storms were observed on 05 May due to coronal hole influence.
- G1 (Minor) geomagnetic storm levels are likely on 15-17 May due to influence from a coronal hole.
Radio Blackout Activity
- R1 (Minor) radio blackouts were observed on 04 May and 07 May due to activity from Region 4424.
- R2 (Moderate) radio blackouts were observed on 10 May due to activity from Region 4436.
3-Day Geomagnetic Forecast
Geomagnetic Activity Probabilities
Kp Index Forecast (Next 3 Days)
Real-Time Solar Images
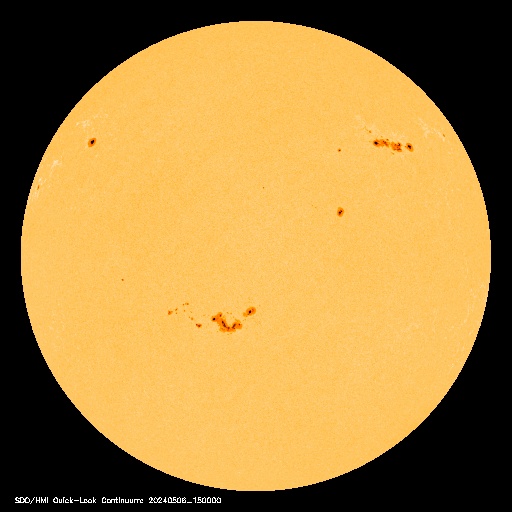
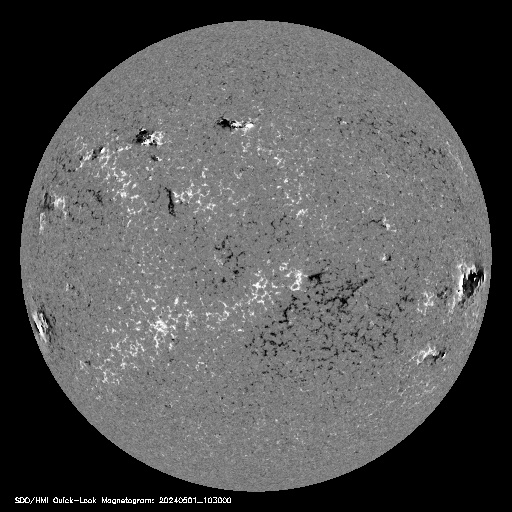
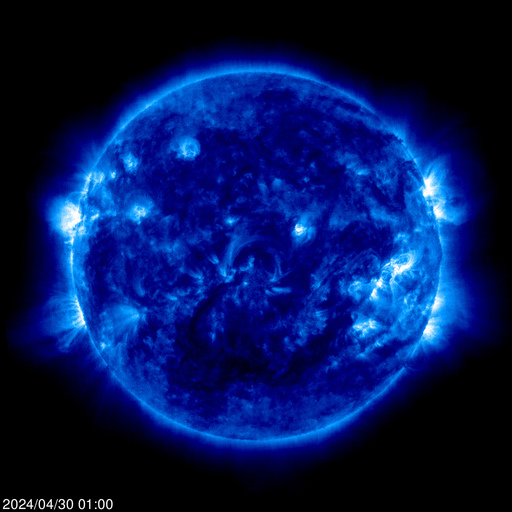
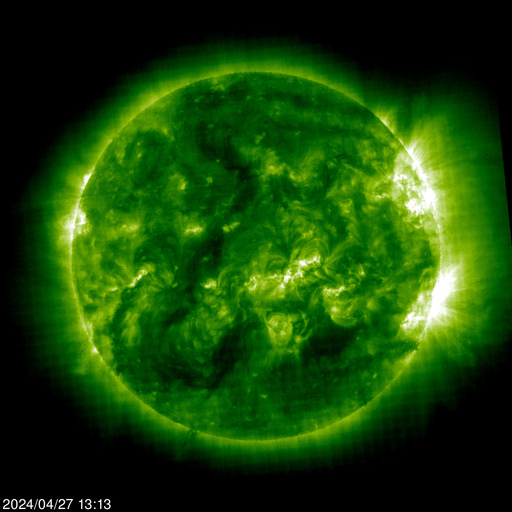
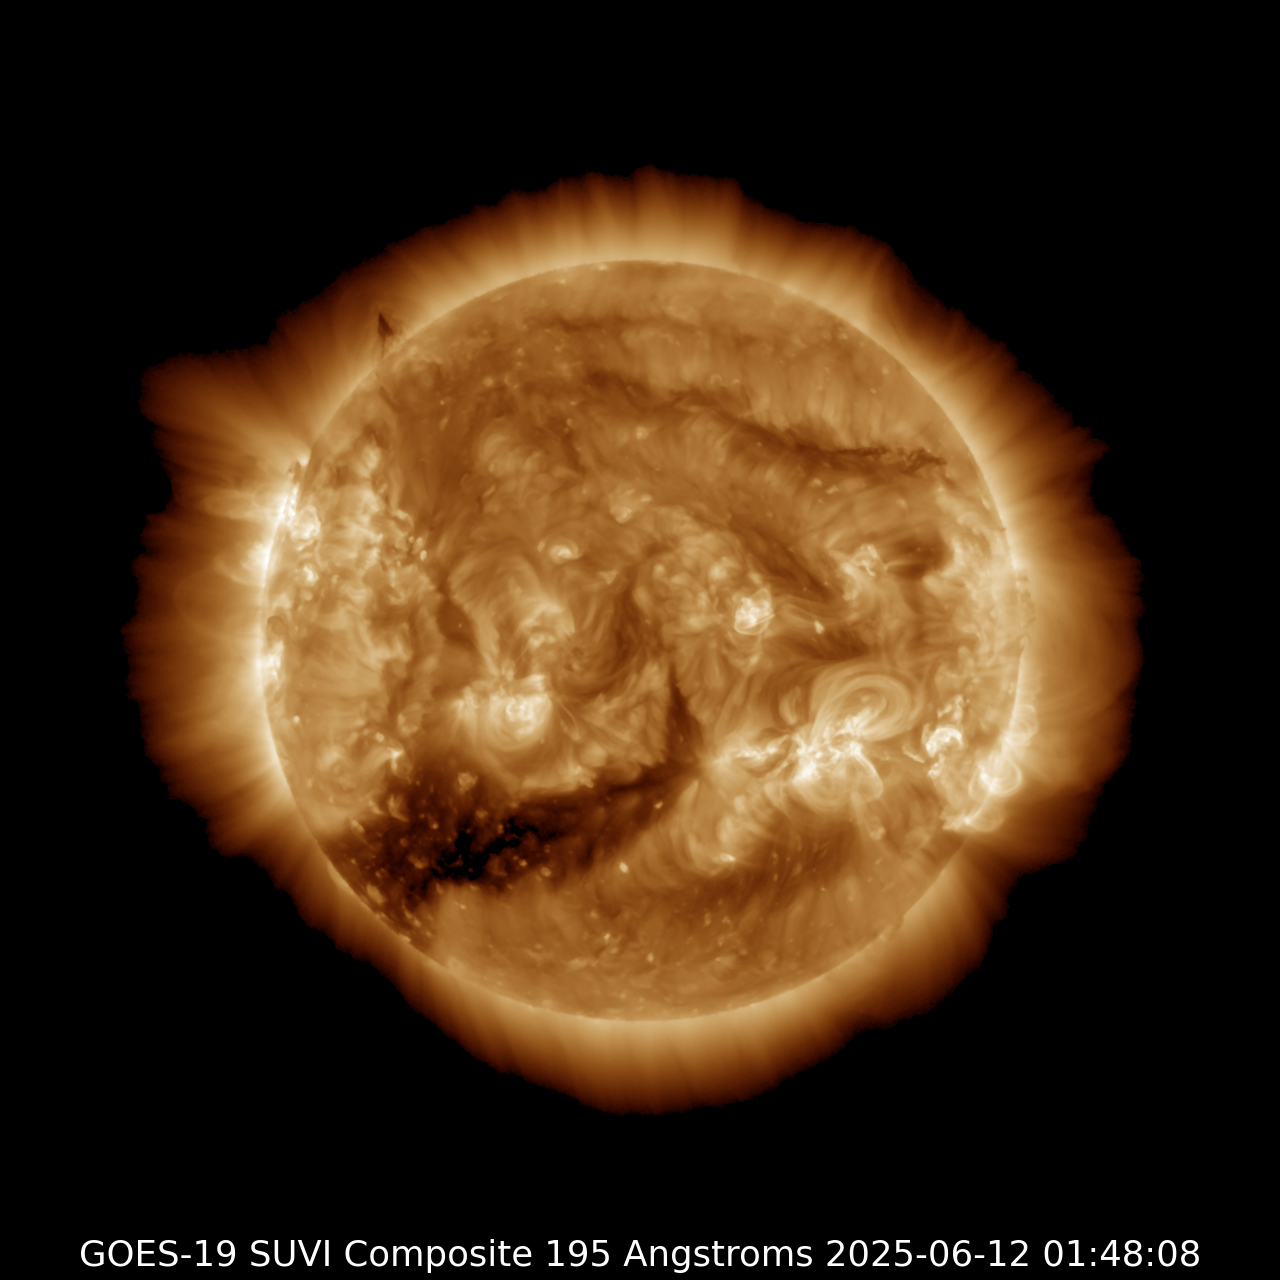
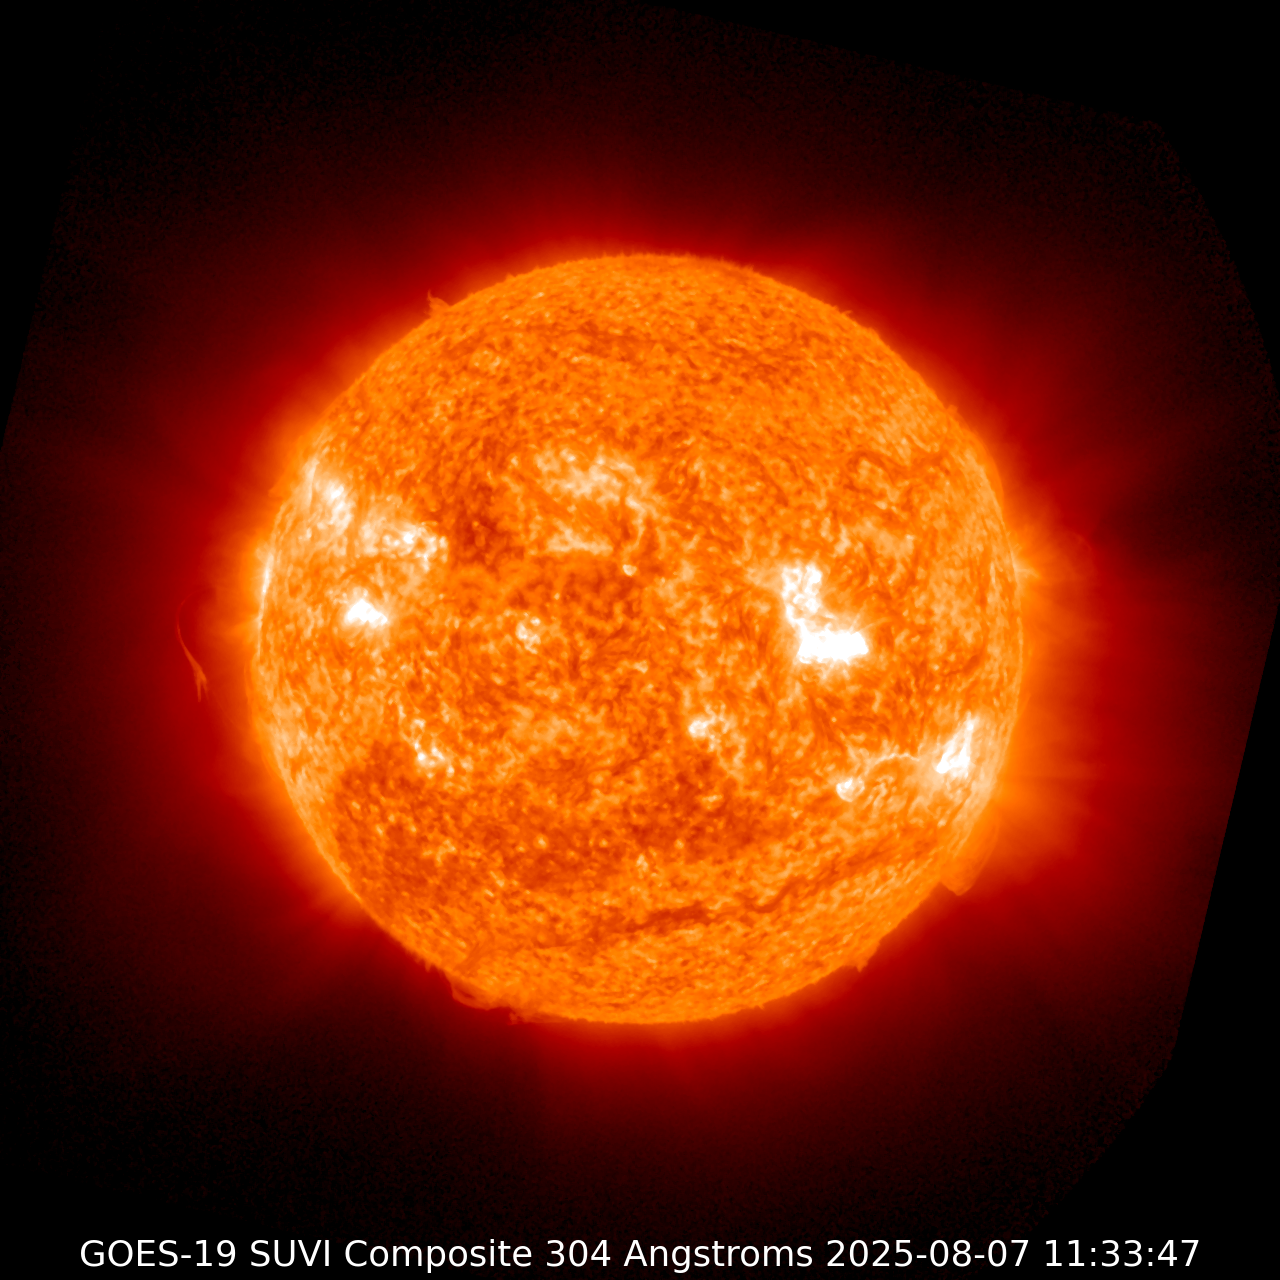
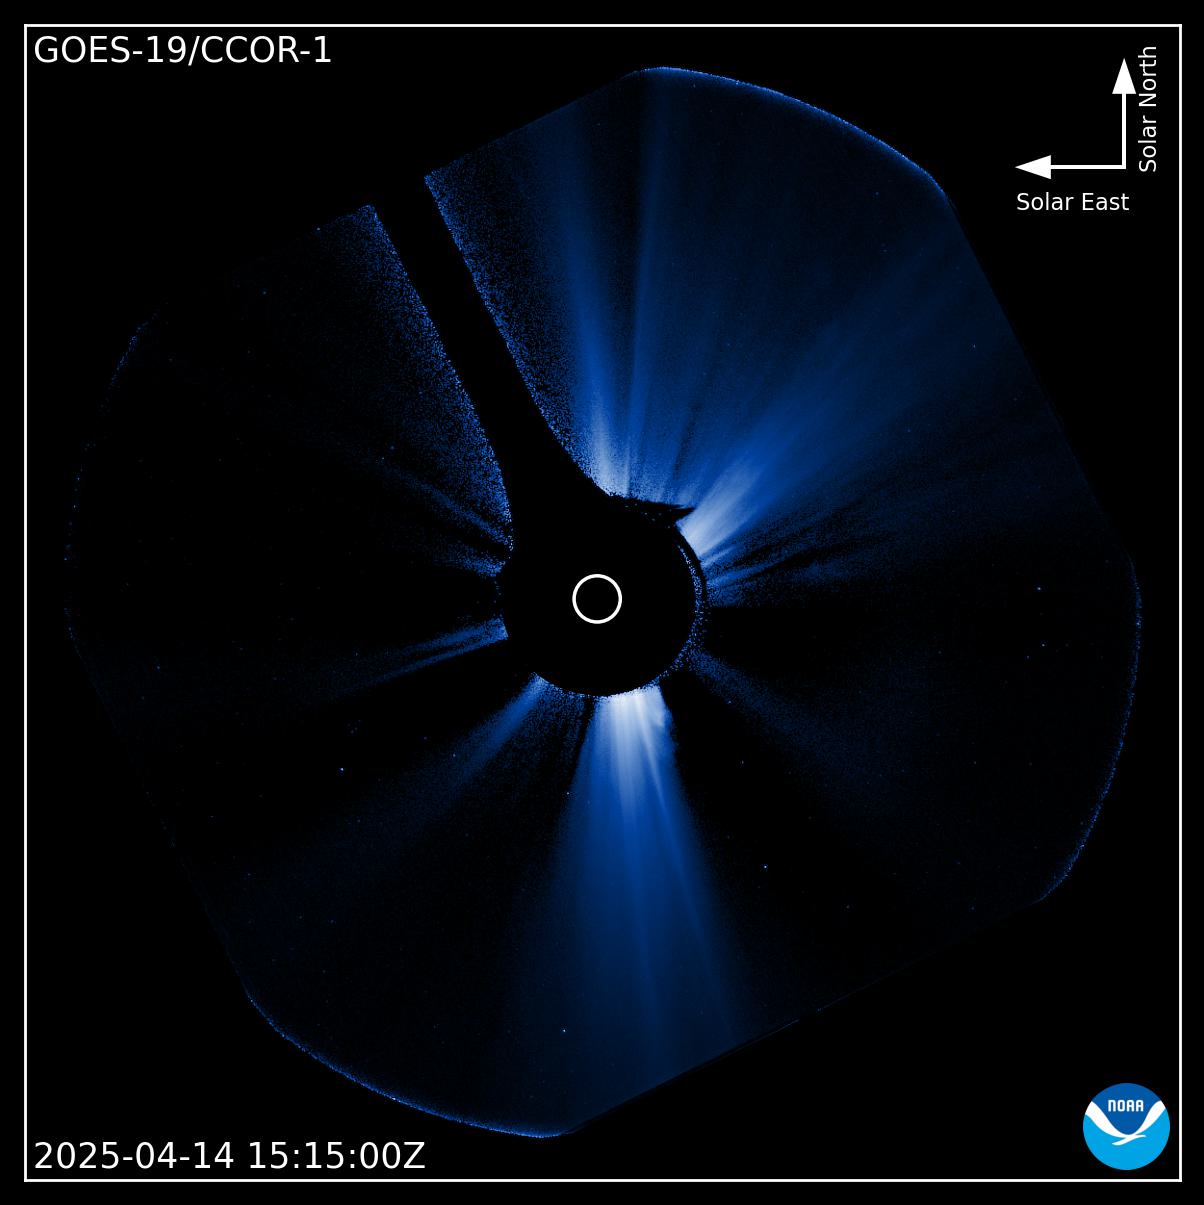
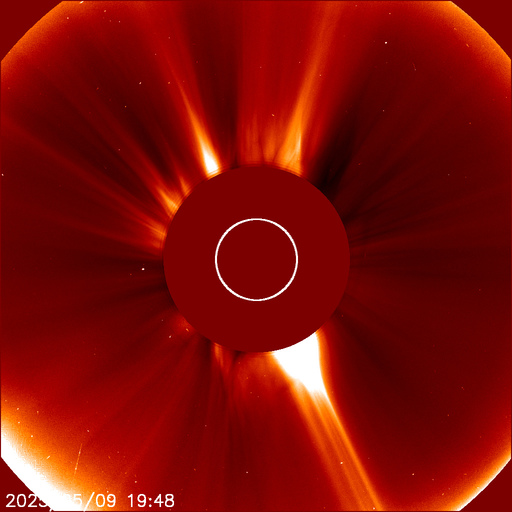
Images from NASA SOHO and SDO satellites. Different wavelengths show solar material at various temperatures. Bright areas indicate active regions and potential solar flares.
Additional NOAA Resources
Educational Resources
NOAA Dashboards
Data Sources
Data Sources: NOAA Space Weather Prediction Center, NASA SOHO/SDO, and your local weather station. Images courtesy of NASA/ESA SOHO and NASA SDO.
Last Updated: May 20, 2026 12:39 AM EDT